6th-Grade Math Assignment
_EDITED_640_694_s.jpg)
_EDITED_640_644_s.jpg)
_EDITED_640_527_s.jpg)
Overview
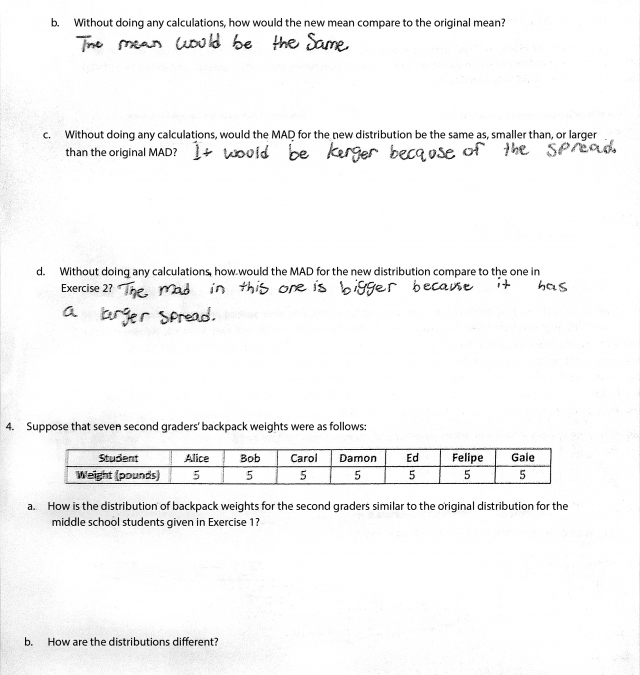
Sixth-grade students draw dot plots to represent data sets, calculate the mean and mean absolute deviation, and explain how the values of the mean and mean absolute deviation would change if at least one value in the data set changed. This assignment is strong because it not only builds students’ skill in calculating these measures, but also builds their conceptual understanding of the measures by asking students to describe and explain them.
Why is this assignment strongly aligned?
Focus
This assignment aligns with two sixth-grade standards:
- 6.SP.B.4 requires students to display data graphically in a variety of ways on a number line, and this assignment prompts students to represent three data sets on a dot plot—a format referenced in the standard.
- 6.SP.B.5.C requires students to calculate measures of center (median and mean) and measures of variability (interquartile range and mean absolute deviation), and also describe these measures within the context of the data set. For this assignment, students had to calculate the mean and mean absolute deviation for three data sets. They also had to describe the data distributions (problem 1c), explain the meaning of the values of the mean and mean absolute deviation (problem 3c), and explain how the values of the mean and mean absolute deviation would change if one or more values in the data set changed (problems 2b-c).
Rigor
This assignment focuses on both conceptual understanding and procedural skill, the two aspects of rigor targeted in standards 6.SP.B.4 and 6.SP.B.5.C. Drawing dot plots and calculating mean and mean absolute deviation allows students to build procedural skill. Students build their conceptual understanding by providing descriptions and explanations of the measures of center and variability. For example, in the problems that ask students to explain how the value of the mean would change if a value in the data set changed, students are asked to not calculate the value of the new mean. Asking students to explain without doing actual calculations is a good way to get them to articulate their understanding of what the mean represents and how individual data points affect it.
Practice Standards
This assignment allows students to engage with multiple mathematical practice standards. Students engage with Mathematical Practice Standard #4 ("Model with mathematics") by mathematically representing real-world topics—like backpack weights—with dot plots. They engage with Mathematical Practice Standard #3 (“Construct viable arguments and critique the reasoning of others”) and Mathematical Practice Standard #6 (“Attend to precision”) by explaining how the values of the mean and mean absolute deviation would change given a new data point and agreeing or disagreeing with another student’s reasoning (problem 2).
![]() This work is licensed under a Creative Commons Attribution Non-Commercial Share-Alike license.
This work is licensed under a Creative Commons Attribution Non-Commercial Share-Alike license.
From EngageNY.org of the New York State Education Department. Grade 6 Mathematics Module 6, Topic B, Lesson 10: Describing Distributions Using the Mean and MAD. Internet. Available from https://www.engageny.org/resource/grade-6-mathematics-module-6-topic-b-lesson-10, and derived from Eureka Math as licensed by Great Minds; accessed June 18, 2018.